 Viderics

Key takeaways
- On ACS 2024 age bands, the Generation Y proxy is about 76.3 million people — 22.8% of the age-banded population (0.7 × ages 25–34 + ages 35–44).
- Across 3,222 counties, population-weighted median household income is about $83,900 and median home value about $399,000; county median home-value-to-income is 2.96.
- 436 counties already sit at HVTI of 4.5 or higher. High Gen Y proxy share with stretched HVTI shows up in places like Kings County, NY and San Francisco County, CA — descriptive context, not a targeting list.
- Public sources for this edition: Census ACS, Census PEP, Census Building Permits Survey, HMDA via FFIEC/CFPB, and Pew birth-year definitions. CPS/ASEC birth-year tables are next.
Who Generation Y is in the latest ACS
Generation Y means Millennials: Pew birth years 1981–1996 (see Pew’s generation definitions). In the ACS 5-year 2024 age bands loaded for every U.S. county in the Viderics marts, the cohort is measured with a published proxy — 0.7 × the 25–34 band plus the full 35–44 band — because ACS does not publish birth-year cuts. That proxy is about 76.3 million people, or 22.8% of the 335 million people in the age table.
That share is descriptive. It is not a score for ranking counties or targeting borrowers. Age and generation figures stay context only; market decisions use income, employment, affordability, migration, lending activity, and supply.

U.S. population by ACS age band
National capacity and the path to ownership
On the ACS 2024 consumer profile (3,222 counties, 338.2 million people), population-weighted medians are about $83,900 household income, $399,000 home value, 65.2% homeownership, and 63.4% labor-force participation. Bachelor’s-or-higher from ACS education counts is 35.6% of adults 25 and over.
Affordability is local. The median county home-value-to-income ratio is 2.96 (interquartile 2.42 to 3.74). Four hundred thirty-six counties sit at HVTI of 4.5 or higher. Where Gen Y proxy share is also high — for example Kings County, NY (26.7%, HVTI 11.28) or San Francisco County, CA (30.8%, HVTI 9.89) — the path to ownership is a payment problem, not a demand-map problem. Counties with similar Gen Y proxy share and much lower HVTI (Houston County, GA; Ector County, TX; Canadian County, OK) show the other side of the same cohort.
Path to own: HVTI where Gen Y proxy share is high
Where the cohort sits, and what supply and mortgages show
Among larger states, ACS 2024 Gen Y proxy share is highest in D.C. (32.1%), Colorado (25.6%), Alaska (25.0%), Washington (25.0%), California (24.2%), and Texas (24.2%), and lowest in West Virginia, Vermont, and Maine (about 20.4–20.6%). State share does not set lending appetite.
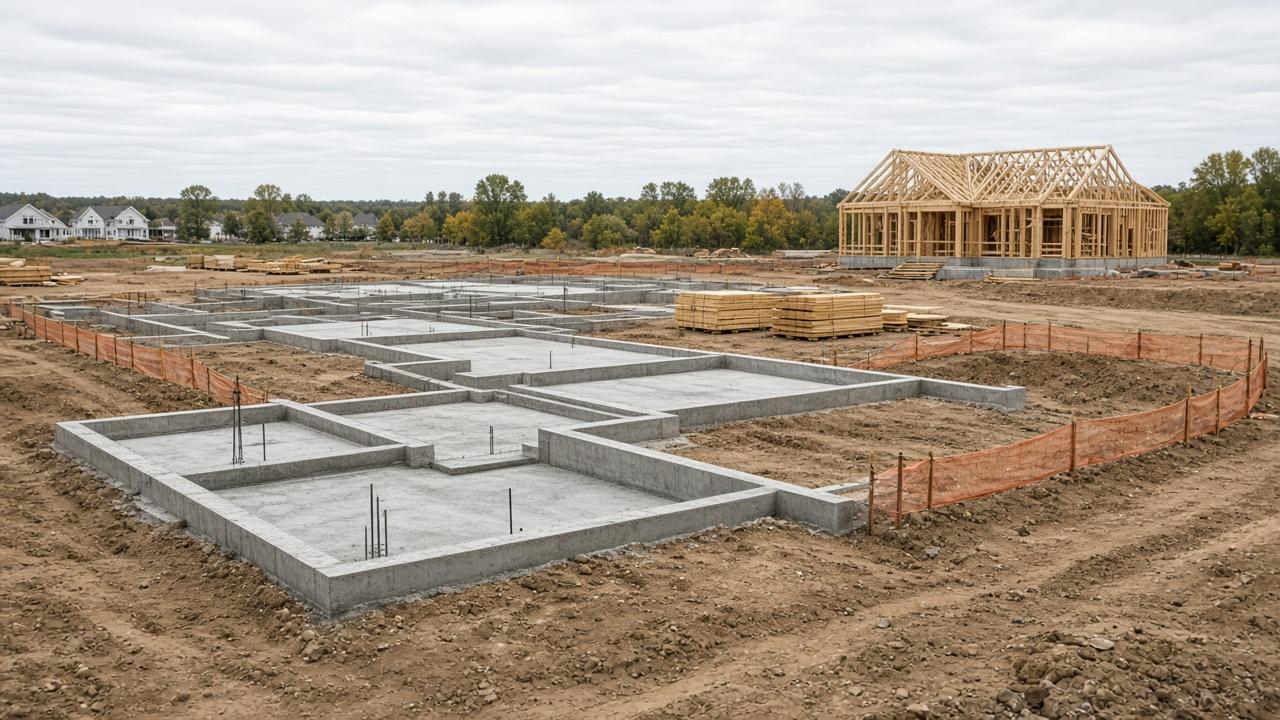
Census Population Estimates for the 2025 companion year show about 341.8 million people in the county PEP rollup and +1.26 million international migration. Census Building Permits Survey 2025 authorized about 1.43 million units (909 thousand single-unit, 520 thousand multi-unit). HMDA lending-terms coverage for 2025 spans 3,223 counties with about 4.47 million originations. Purchase-only national totals wait on a complete clean LAR county rollup.
Highest Gen Y proxy share by state

U.S. building permits authorized (2025)
Sources
U.S. Census Bureau, American Community Survey — https://www.census.gov/programs-surveys/acs (age, education, income, tenure, home value, rent).
U.S. Census Bureau, Population Estimates Program — https://www.census.gov/programs-surveys/popest.html (population change and migration). U.S. Census Bureau, Building Permits Survey — https://www.census.gov/construction/bps/ (authorized units). FFIEC / CFPB, Home Mortgage Disclosure Act — https://ffiec.cfpb.gov/ (originations and denial rates). Pew Research Center generation definitions — https://www.pewresearch.org/short-reads/2019/01/17/where-millennials-end-and-generation-z-begins/ (birth years 1981–1996). Planned adds: Census CPS/ASEC for true birth-year cohorts — https://www.census.gov/programs-surveys/cps.html — and American Housing Survey — https://www.census.gov/programs-surveys/ahs.html.
PDF edition
Take this report into the room.
Want to see your markets?
On a 30-minute call we’ll show you where demand and supply stand in the markets you care about. Bring your toughest one.
Viderics provides market information and analytical tools for professional audiences. Nothing on this site is investment, legal, tax, or lending advice.
← All research